01Outcome
From hackathon spark to product vision
A shelved but complete product vision with analytics managers could use in 1:1s, retros, and planning — daily mood, location, and anonymous contribution in one calm dashboard.

Web App · 2024
An intuitive employee mood tracker.
Genki is a team dashboard where employees log their mood each day, set where they are working (home, office, or at a client), and share anonymous feedback or ideas in a Think Tank.
Charts and diagrams aggregate moods and locations over time so managers can understand team wellbeing, spot mood swings, and reflect on what might be driving them.
01Outcome
A shelved but complete product vision with analytics managers could use in 1:1s, retros, and planning — daily mood, location, and anonymous contribution in one calm dashboard.
02Project context
Managers often lack a lightweight, ongoing read on team mood — annual surveys are too slow, and ad-hoc check-ins do not scale when people are remote, on-site, or at clients on different days.
Teams needed a humane way to track wellbeing and surface ideas between formal reviews.
03Evolution
Genki began as a hackathon concept — a simple way for teams to check in on mood and surface thoughts. I led UX from that first prototype through high-fidelity dashboards, charts, and mobile flows.
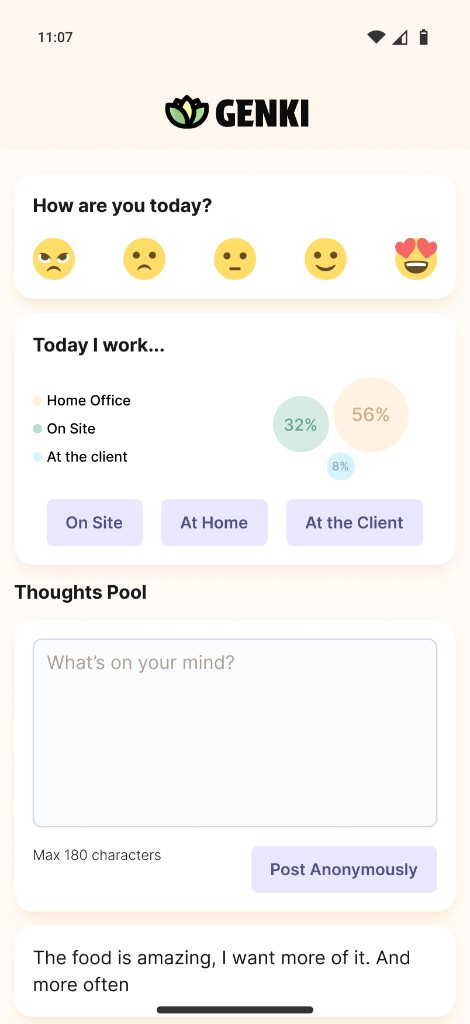
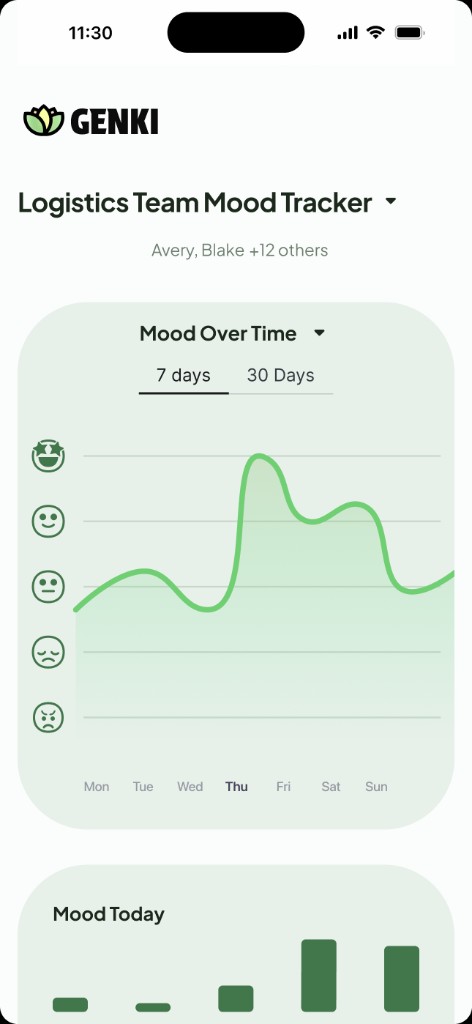
Early hackathon prototype → refined mobile mood tracker.
04Solution
The main view brings mood, work location, and trends into one screen — employees check in within seconds, and managers see how the team feels today and how patterns evolve.
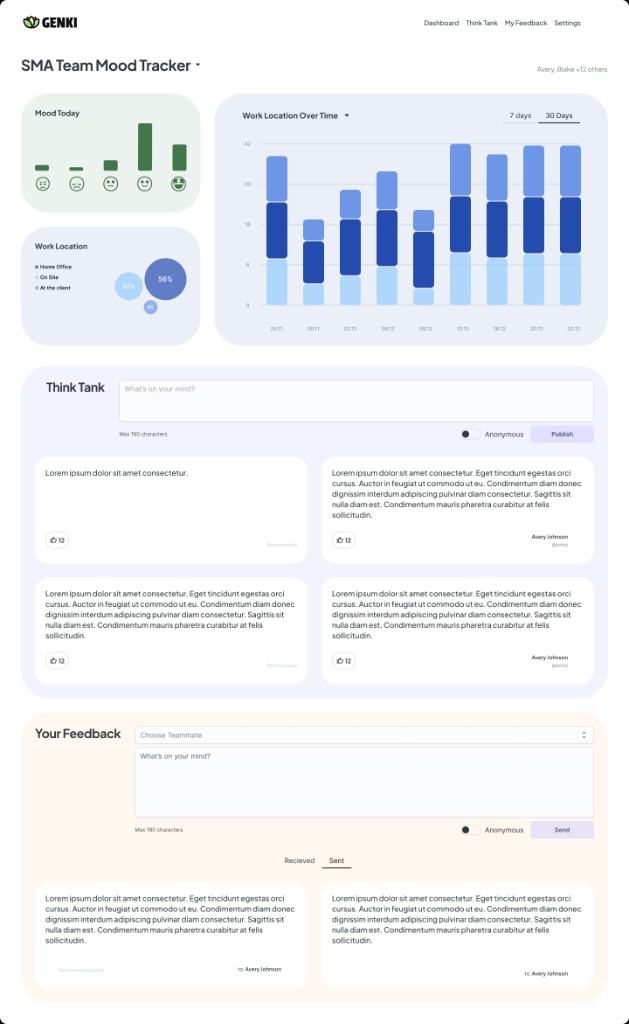
SMA Team Mood Tracker — dashboard overview.
05Analytics
Charts and diagrams aggregate moods and locations over time so leads can spot swings, compare weeks, and discuss causes with the team retroactively.
01Key insight
A single day's mood says little on its own — managers need patterns over weeks to read what is actually happening in the team.
Design response — Widget-level charts break down today's sentiment, work location, and mood over the last seven or thirty days — built for quick trend reading in 1:1s and retros.
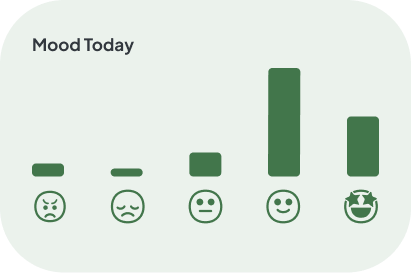
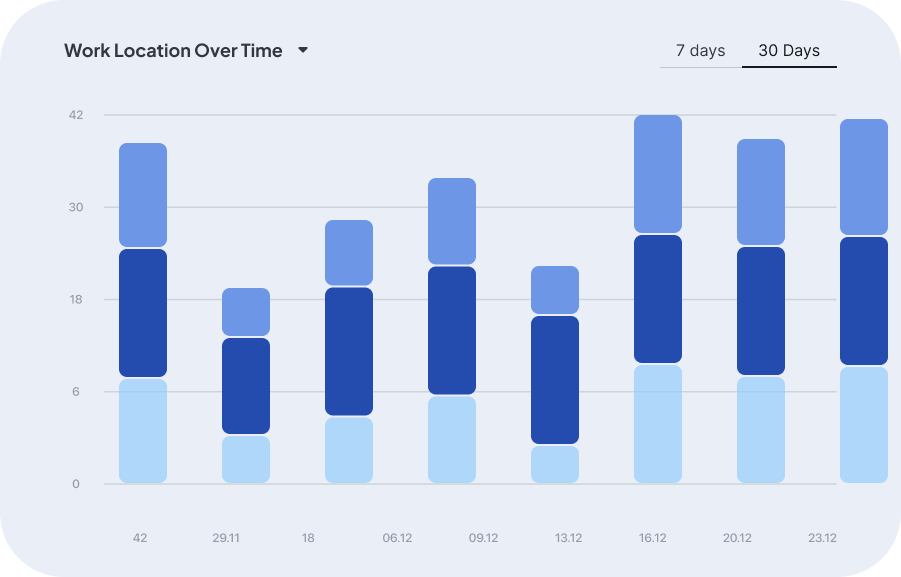
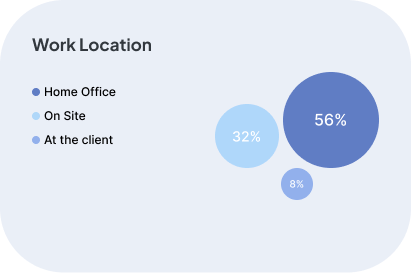
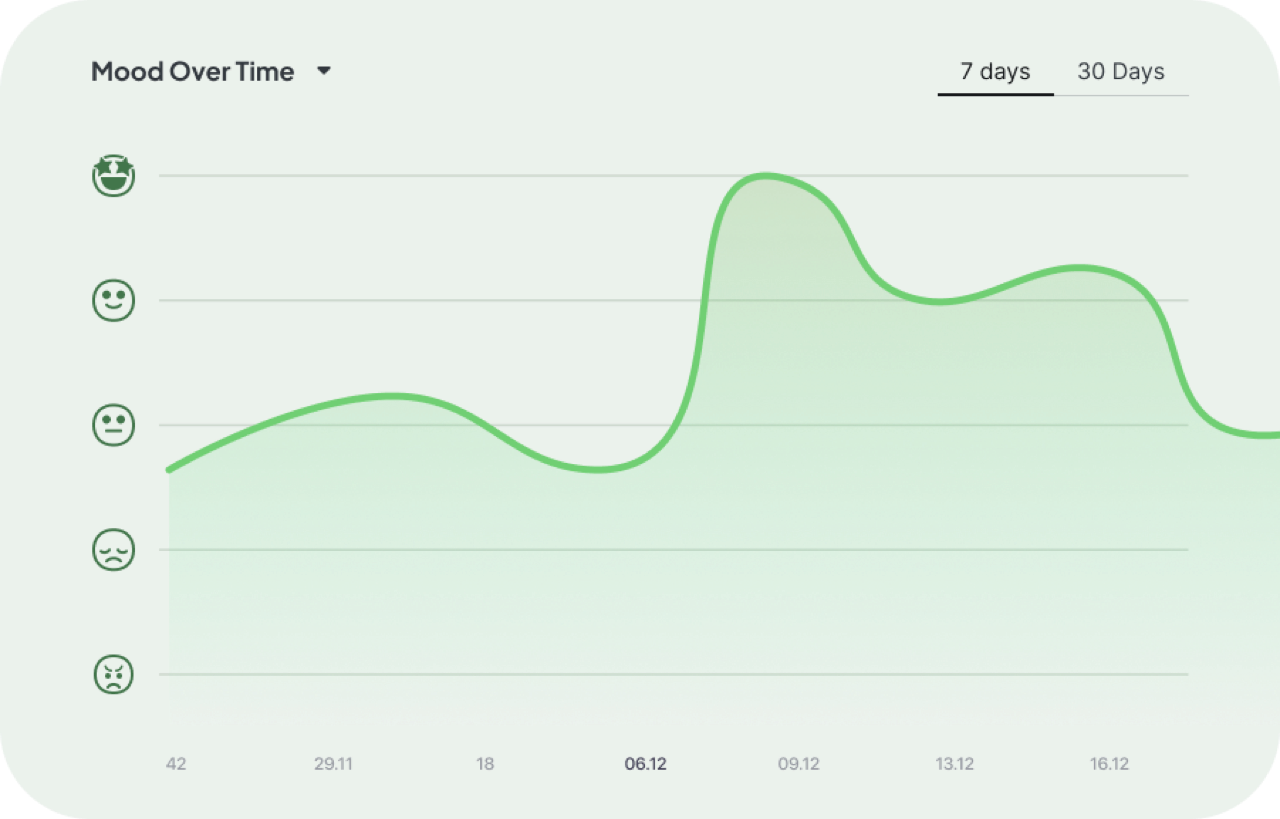
Mood Today, Work Location Over Time, Work Location, and Mood Over Time.
06Think Tank
Employees post ideas and feedback anonymously or by name. A simple publish flow and card feed keep contributions lightweight while giving managers a pulse on what the team is thinking.
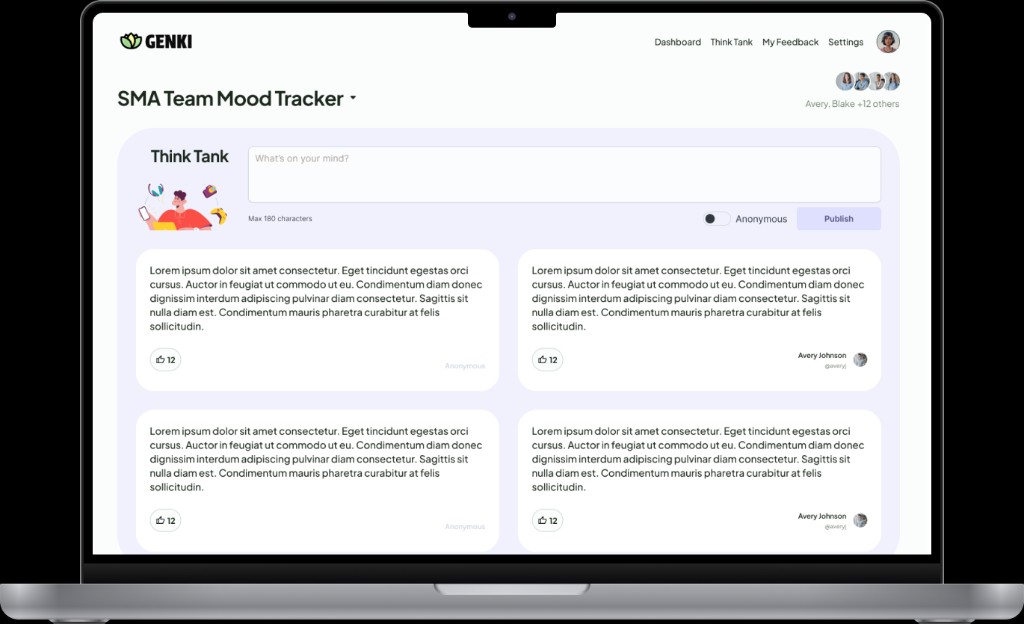
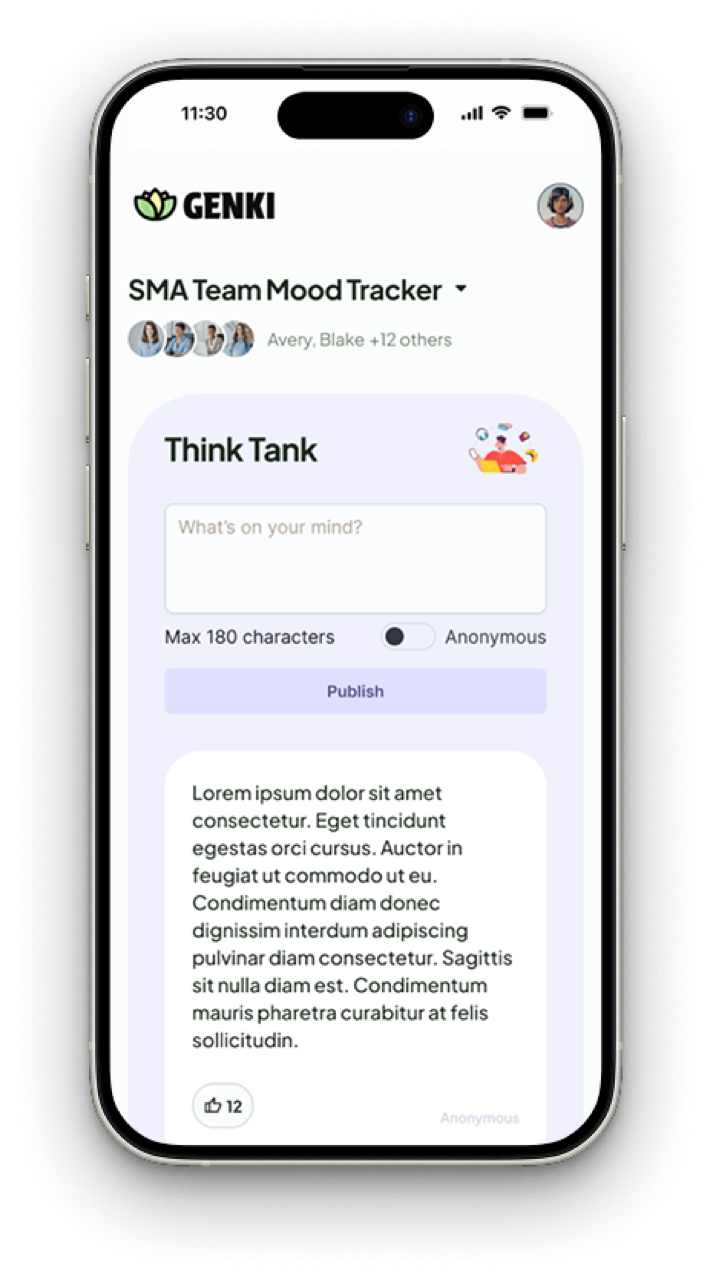
Think Tank — desktop and mobile.